Icons & Sketches


Blog Post Diagrams & Icons
Each of my blog posts is accompanied by a simple sketch or diagram which further explores the blog post topic.

A visualization of loneliness.

This is a typical circle structure (or organizational structure) for a group using sociocracy. The center-most circle is the General Circle and all other circles are directly or indirectly connected to it.

Access to electricity fosters life and growth.
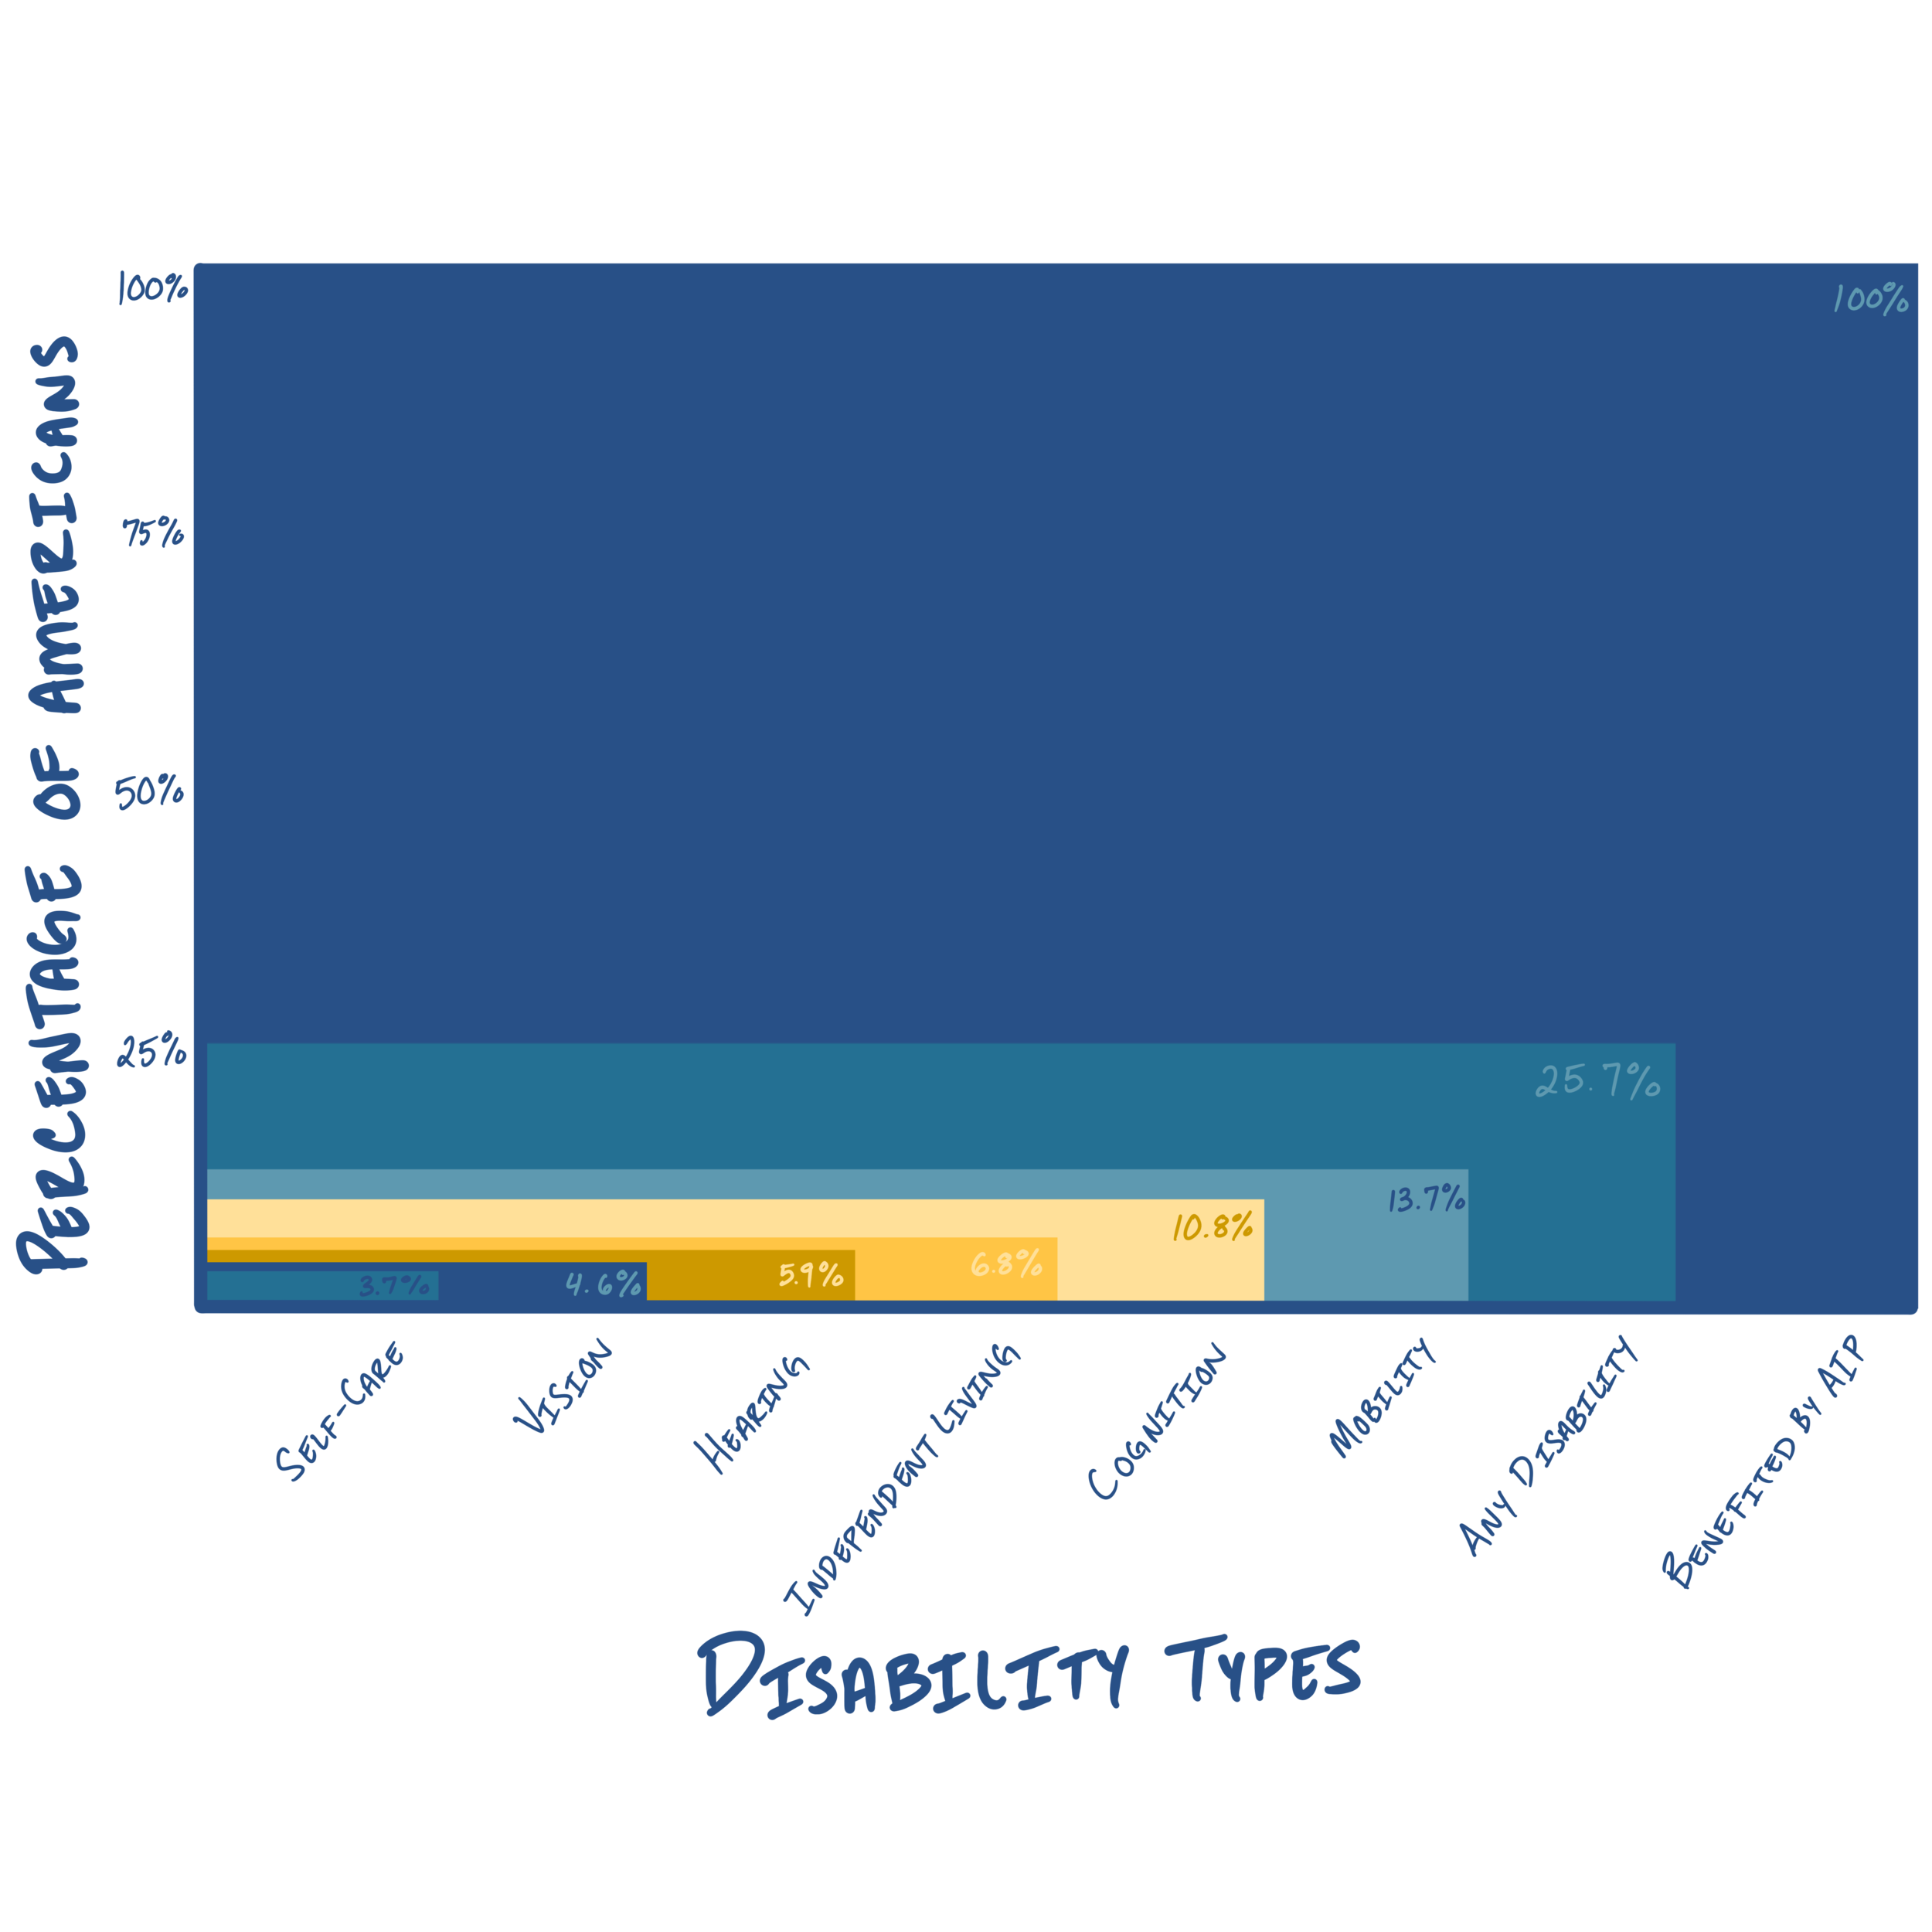
Who benefits from Aging In Place design? This graph illustrates the percentage of Americans impacted by different disability types as well as the overall percentage that would be benefited from designing for Aging In Place.

This diagram is an illustration of how tables and records in Airtable are interlinked. The dark blue outline indicates the table and the light blue sections are the fields within records. For example, you can have a "Task” table linked to a “Meeting” table which would create a field where you could connect any number of tasks to a meeting (and vice versa) even while taking meeting notes in real-time.

This is an illustration of the concept of transparency, demonstrating how defined spaces can been connected visually and allow for views to extend through them.

Illustration of the relationships between the various pieces of an Airtable workspace.
Time-Lapse Video